Why RTLS projects usually start with logistics
Most real-time location system (RTLS) programs tag forklifts and tuggers first. Continuous travel and fleet load are plant facts that WMS and MES usually do not record.
What starting with logistics means
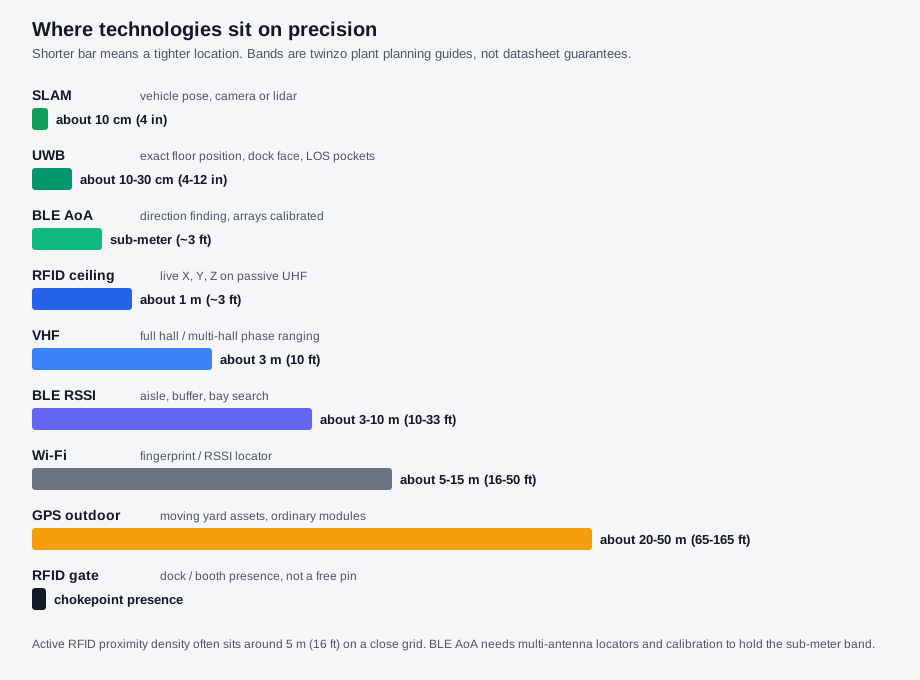
Starting with logistics means putting continuous location on the assets that already move material: forklifts, tuggers, and cages on known loops. That is forklift tracking and broader asset tracking for industrial fleet management, not a robot business case on day one. Medium-precision location around 1–3 m (3–10 ft) is usually enough to rebuild corridors, empty travel share, and dwell in buffers. The same picture feeds internal logistics optimization before anyone prices a robot cell.
That is not a claim that production does not matter. Line waits and material readiness still belong on production monitoring. The logistics start is the filter: prove how travel and fleet load waste the shift, then decide whether the next budget euro or dollar buys tags, a layout change, or a robot. The RTLS definition behind that filter sits under what RTLS is.
Why downtime used to buy more capacity
When a line starved, plants often measured missing completes, not empty kilometers (miles) or aisle dwell. The cheapest easy fix was capacity: rent another forklift, add a night seat, or pad the milk-run. WMS and MES still showed tasks and station counts. They did not show how much hunt sat between the radio call and the drop.
That gap trained sponsors to treat more movers as more flow. Spare trucks looked like insurance while real load stayed invisible, so the next starve still bought the next unit. Industry practice for material-handling measurement still starts by mapping travel distances, idle waits, and deadhead share before sizing the fleet. How empty-round patterns drain a hall is under when RTLS makes sense for forklifts.
What the logistics RTLS layer buys beyond fleet cuts
The same continuous locations that cut empty travel also build three equal plant jobs on one hall. Live logistics and shift operations answer search, fleet load, and waits on a map people trust. The spatially oriented dataset under that view stores place and time so later models have an honest record, the plant form of spatiotemporal history. Correlation and causality analytics on that record turn hall-wide pairings into evidence for continuous improvement, not into guesses built from radio chatter alone.
None of those three jobs replaces the others. A logistics-only dashboard that never stores history cannot feed later pattern work. A dataset nobody connects to waits and movers is only archive. Pattern charts without a trusted live hall stay detached from the shift. twinzo keeps those pillars on one operational layer once the movers are tagged.
AMR growth makes the order stricter
Autonomous mobile robot (AMR) and automated guided vehicle (AGV) programs are rising under the same material-starve pressure. Vendors sell predictable loops and lower labor. Mobile-robot shipments have grown sharply in recent years, yet most plants that add robots still run a hybrid fleet for months or years. The floor still has the same broken routes, temporary parks, and uneven load that made manned fleets look short. Replacing a driver with a robot on that system copies the waste into a CapEx line.
Lean manufacturing practice says optimize the process before you automate it. The challenge before robotization is sizing the fleet and cleaning travel while the decision is still soft: how many robots for the real residual load, which corridors are stable enough to automate, and which hops stay chaotic and should stay manned. Live spaghetti diagrams and logistics heat maps answer those questions with measured meters (feet) and minutes, not with a claimed daily-move total on a presentation slide. Measuring the manned baseline before the robot quote hardens is a practical smart manufacturing step.
Fleet management for AMRs still needs that truth. A robot that sits in the same pinch point a forklift sat in yesterday does not raise OEE. It raises invoice volume. Fleet saturation work on tagged movers first is under balancing forklift fleet saturation. Relayout and automation corridor choices from a live value-stream picture are under real-time value stream mapping.
Fix the process, then automate
Process first means naming the parks, assists, and empty loops the standard flow never wrote down, then deciding which ones to erase and which ones to teach into the next layout. Automating a broken milk-run locks the break into software and equipment. Automating a cleaned corridor buys repeatable travel on a path people already proved. Industry guidance on logistics automation follows the same sequence: understand the site flow, cut waste, then field a hybrid manned-and-robot mix on the residual load.
Simulation can test robot counts and aisle widths on paper once the live hall has taught the real residual load. That capital filter sits under what a simulation digital twin costs and what it buys. The live half that feeds those studies is the logistics RTLS layer, not a second command center of robot screens. Unknown shadow moves that keep the shift alive still need classification before they become AMR missions. That habit is under unknown processes on the live floor.
How to decide if logistics is your start
1. Check whether downtime still buys capacity by default - If the last three starves produced a rental, a headcount pad, or an AMR quote before anyone measured empty share, logistics visibility is the missing step.
2. Price one robot or truck against one week of measured travel waste - Empty kilometers (miles), dwell in the wrong bay, and hot-truck overload often dwarf a bounded tag program on the existing fleet.
3. Separate stable corridors from chaotic hops - Automate only what the live map shows repeating under load. Leave low-frequency chaos on manned movers until layout or call rules change.
4. Name the owner after the first map - Logistics owns travel and fleet load. Industrial engineering owns which loops become AMR candidates. Production owns the wait signals that prove the starve was material, not a machine fault. Continuous improvement owns the stored spatial record and the causality reviews that follow.
Capability depth for the live hall sits on the features overview. Where RTLS benefits usually land after that start is under where RTLS benefits show up. How a rollout is priced is on pricing.
KPIs that match this sequence are useful moves per truck, empty travel share, and time from starve signal to assigned drop, not vehicle hours alone. A bottleneck talk that only counts station cycles will keep buying capacity. A talk that includes travel will start with internal logistics.
Get in touch if you want to walk whether your next downtime answer should still be another truck or robot, or a measured logistics start on the hall you already run.