What the smallest documented RTLS case actually looked like
An entry-scale real-time location system (RTLS) on a mid-size logistics hall can cost a few thousand euros. One documented case earned year-one OPEX return from live position and clearer shift balance.
What the documented case measured
A documented 15,000 m² (about 161,000 ft²) logistics-center warehouse used RTLS for live positions and shift-balance work. Investment was €3,500 (about $3,850). First-year OPEX saved was €11,000 (about $12,100). The practical outcome was real-time visibility across an L-shaped layout plus clearer cross-shift workload balancing. That is the entry baseline for operational visibility on this size band. It is not a full plant digital twin, not a multi-site rollout, and not a promise to release trucks. It is enough live position data on the assets that move material to stop guessing where bottlenecks sit between shifts.
Command-desk consolidation on the same size band is a separate documented case. An automated ordering system (AOS) invested €28,000 (about $30,800) and recorded €65,000 (about $71,500) of year-one OPEX saved after two desks became one. Leave those figures with why a second command center quietly inflates OPEX and small warehouse visibility and one command desk. Do not fold the €3,500 (about $3,850) / €11,000 (about $12,100) RTLS visibility result into the desk story.
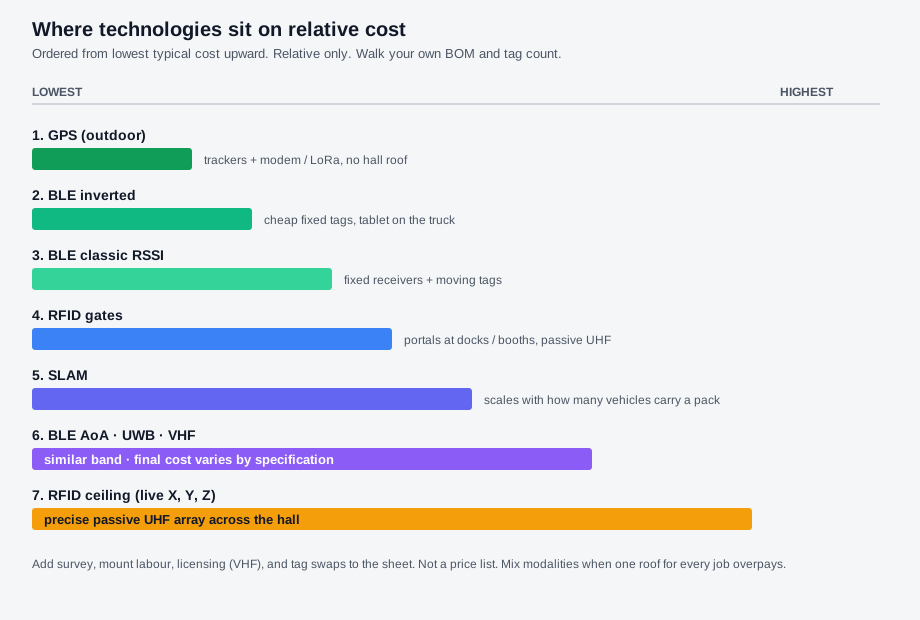
Why the cost side stays low when the footprint is modest
twinzo prices by data points rather than by named users, so the licence cost scales with the number of tracked positions instead of headcount. Licences run for one year and renew automatically unless dropped. A one-month free trial is available before any commitment. Current commercial detail sits on pricing.
Deployment for this scale of facility typically lands between one and three months. That window covers sensor placement, tagging, calibration, and the first live map. Nothing in the case suggests the warehouse needed a full CAD rebuild or extensive BIM cleanup before the RTLS layer could start delivering positions. Medium precision around 1–3 m (3–10 ft) is already enough for aisle, buffer, and bay balancing on this job. Coarse zone presence alone will not show which bay is quiet. Exact floor position under about 1 m (about 3 ft) is a different spend and is not required to prove shift balance.
Where the €11,000 (about $12,100) came from
The savings are attributed to real-time visibility and the resulting ability to balance work across shifts more evenly. In an L-shaped warehouse the blind spots are geometric: one leg of the building can look busy while the other sits idle, and paper or radio updates lag behind the actual movement of forklifts and materials. Once positions update live, supervisors can see the imbalance as it forms rather than after the shift ends.
Spaghetti diagrams and shift analytics built from the same position stream show repeated empty runs or dwell clusters that were previously invisible. The case does not claim fleet reductions or FTE cuts at this scale. The measured benefit is the OPEX line tied to better shift balancing. How that method works on a larger fleet sits under shift balancing with RTLS. How a thin pilot should learn before a plant-wide buy sits under what a two-to-four-week hall pilot actually costs to learn.
Live logistics, stored record, and pattern work stay equal
Live forklift tracking and related asset tracking on the map are only one of three equal reasons to run the layer. Positions still feed the spatially oriented dataset under the live view, the place-and-time record continuous improvement and later models need. Correlation and causality analytics use that same record when idle clusters on the quieter wing consistently show up before late outbound waves, or when cross-shift imbalance consistently shows up before Saturday requests. Shift reaction, the stored spatial record, and hall-wide pattern work stay equal pillars. A small RTLS buy that only demos the live map and never stores the events has not finished the operating rule for an operational digital twin.
Keeping live tracking, the stored spatial record, and pattern analytics on one stack is a practical smart manufacturing and lean manufacturing move for internal logistics. Internal logistics optimization is where those paths should be readable by the people who will rebalance the shift, not only by a weekly report.
Deciding whether this minimal scale fits
1. Name the visibility gap in hours or money you already lose - Idle movement, uneven shifts, and search on a mid-sized layout. If that loss is thin, do not buy a map to decorate a problem you do not have.
2. Keep the commercial footprint as narrow as the question - Data points for the movers that own the imbalance, not a plant-wide seat count.
3. Do not paste a larger plant's return onto this floor - Documented automotive halls in the same documentation set invested €81,000 (about $89,100) or €120,000 (about $132,000) and recorded higher absolute savings. Those sites started with bigger fleets and more complex flows. Matching both the €3,500 (about $3,850) investment and the €11,000 (about $12,100) saving requires matching the same starting conditions: modest footprint, existing visibility gaps, and willingness to act on the live map once it is running.
4. Attribute the investment and the saving to RTLS only - Do not add desk-consolidation or AOS euros into this ROI pair. Capability depth sits on the features overview. How a rollout is priced sits on pricing.
The decision point is narrow: does the warehouse already lose enough OPEX to idle movement and uneven shifts that entry-scale RTLS coverage would surface the pattern? The case supplies one concrete answer for one L-shaped logistics center. Get in touch if you want to size that same entry floor against one imbalance you can already name.